Thermal Infared Photography
Cool-Coat Comparison
How did you Compare the Cool-Coat?
I used the Flir Ignite Thermal Comparison tool and made a polygon selection around the before and after cool-coat images displaying the sustainable city. I then used the delta tool to compare the two average temperatures of the polygon selections. The video shows the tool measuring the temperature average of the pre-cool-coat capture on the right and the post-cool-coat capture on the left.
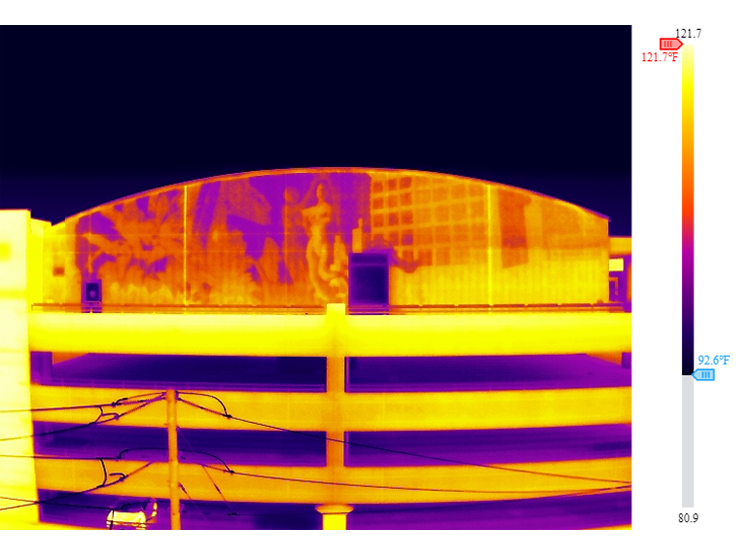
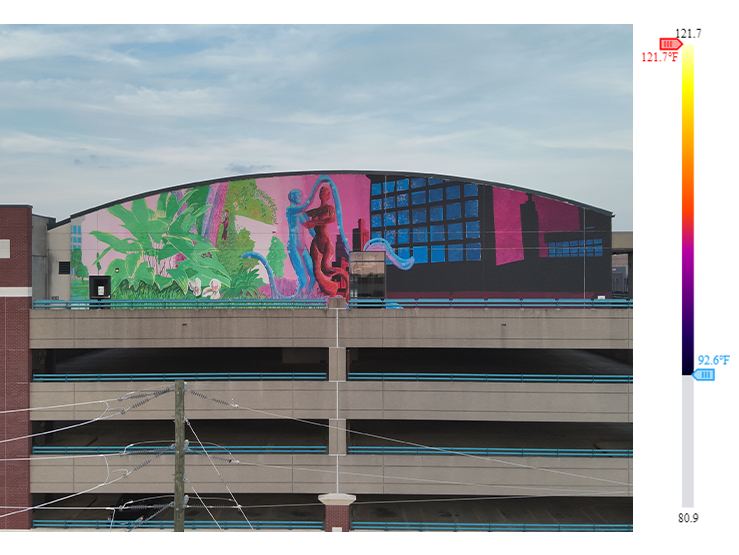
Slide to see Before and After Comparison
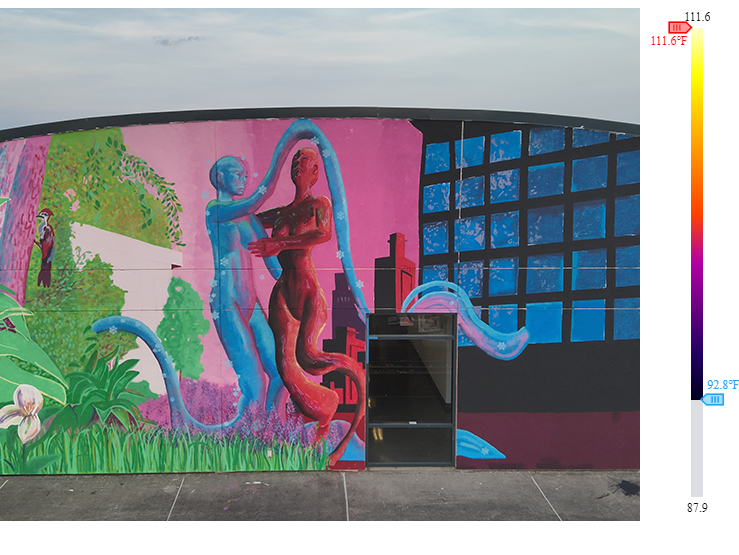
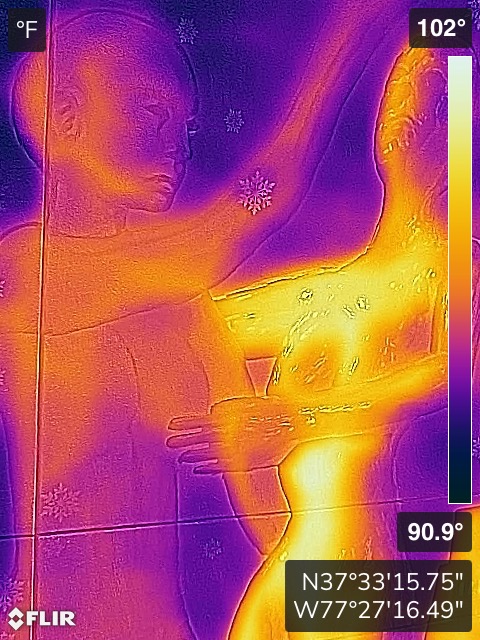
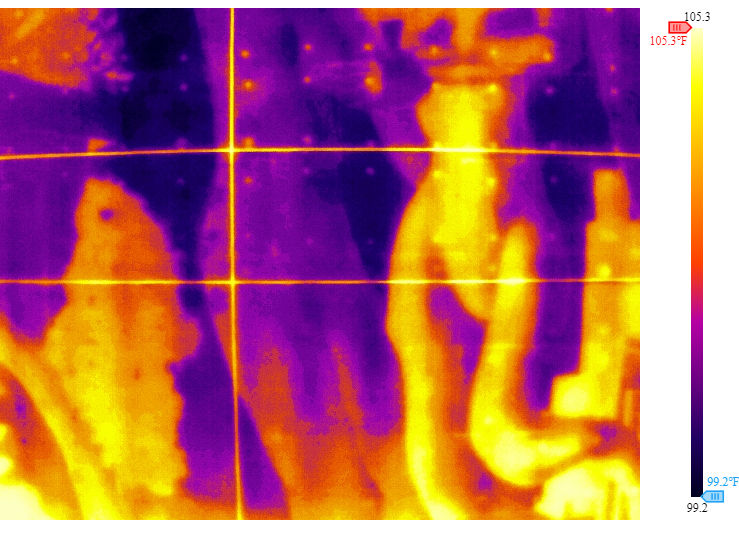
The mural’s 1st coat surface layer used regular mural paint. After painting the final colors, I went over the “sustainable city” section of the mural with a clear cool-coat sealant. I documented the before and after comparison with my thermal infrared camera to see how much of a temperature-cooling difference the coat made. Two coats are on the sustainable/blue figure, and one coat is on the surrounding environment of the sustainable city. No coats are on the urban heat island/red figure and their environment.
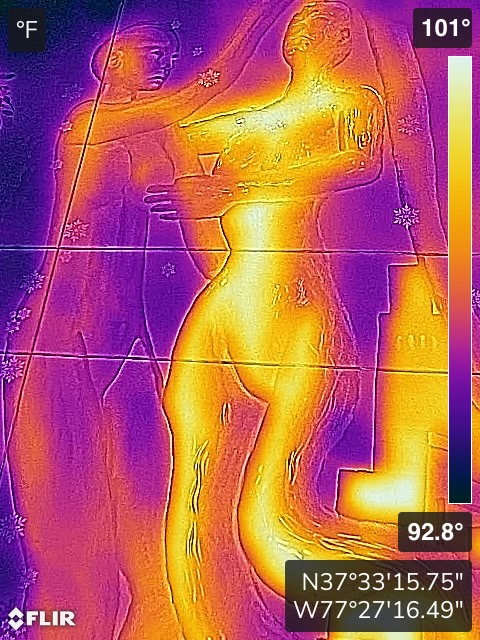
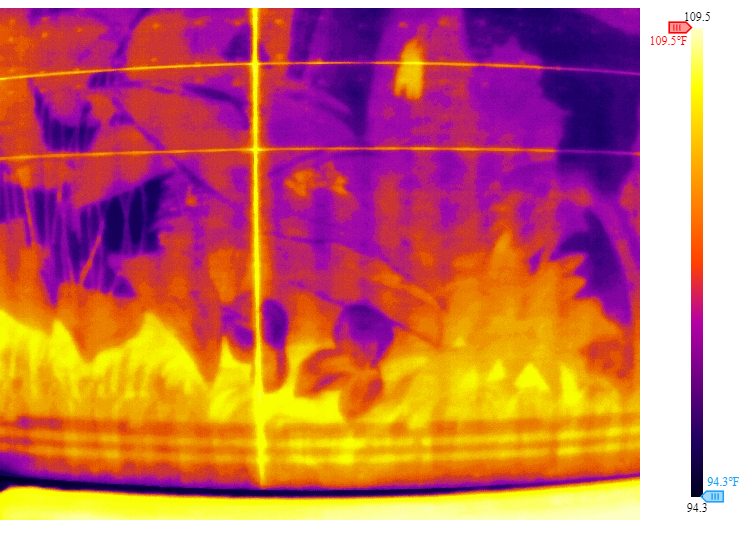
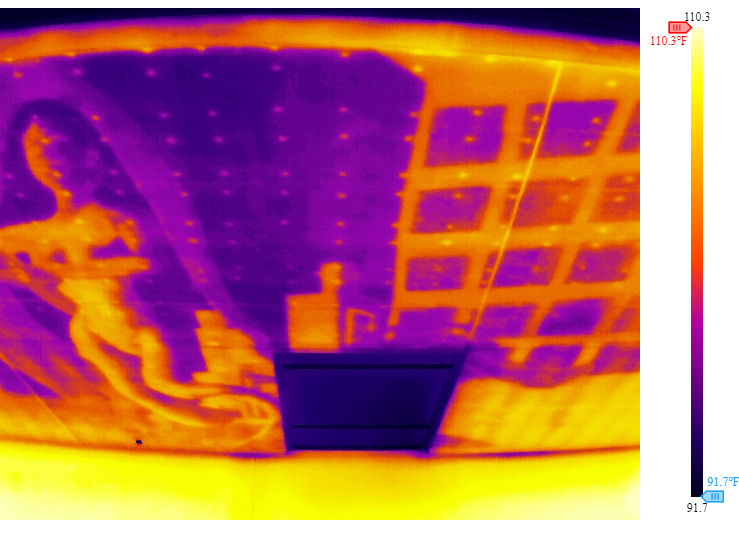
Before Cool-Coat Sealant (Sustainable Figure)
- Capture Date: 8/5/23
- Capture Time: 2:06pm
- Outside Temperature: 88° F
- Capture High Temperature: 99.1° F
- Capture Low Temperature: 94.3° F
- Average: 96° F
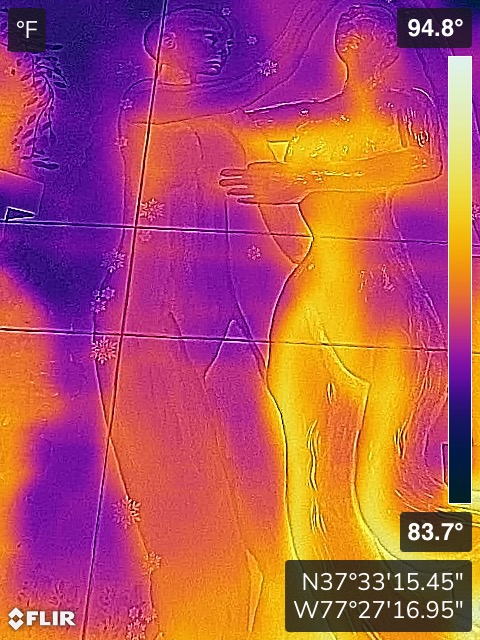
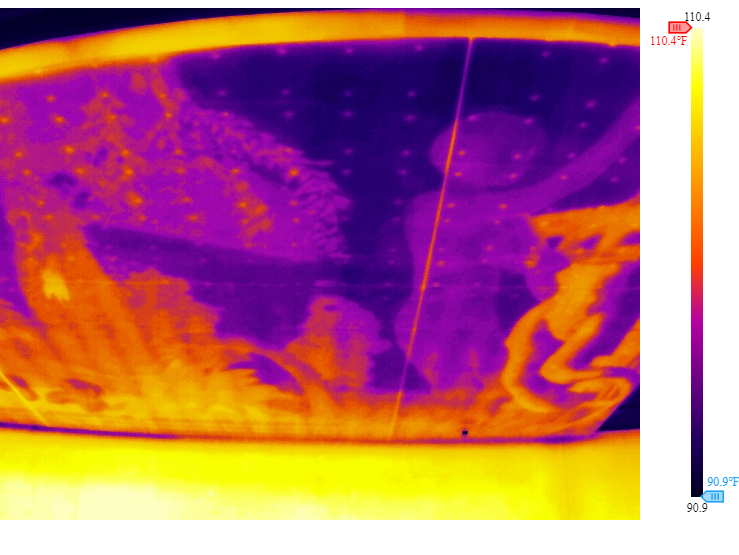
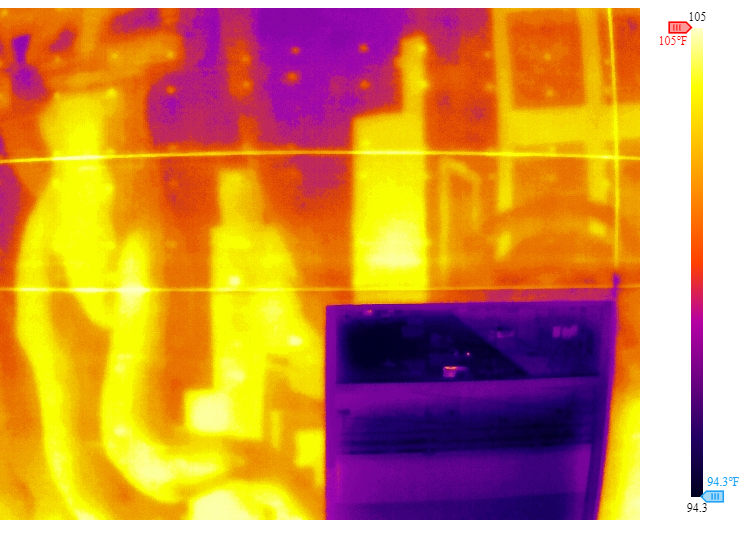
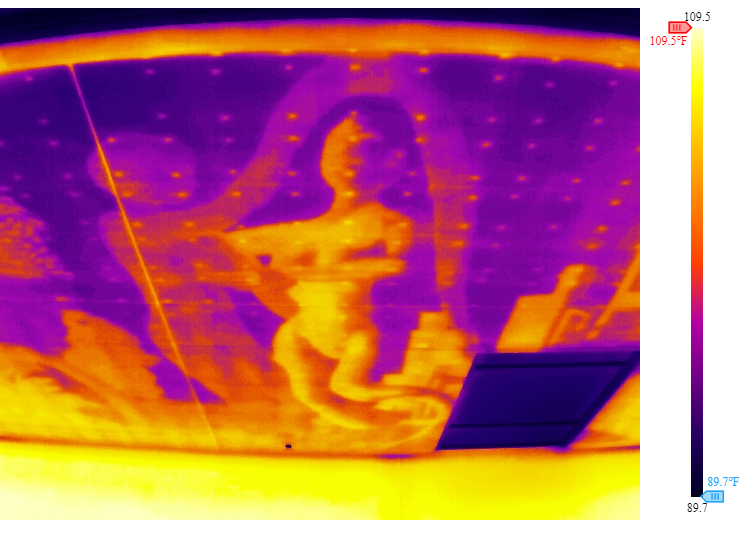
After the Cool-Coat Sealant (Sustainable Figure)
- Capture Date: 8/20/23
- Capture Time: 2:15pm
- Outside Temperature: 91° F
- Capture High Temperature: 92° F
- Capture Low Temperature: 86.4° F
- Average: 88.3° F (-7.7° F)
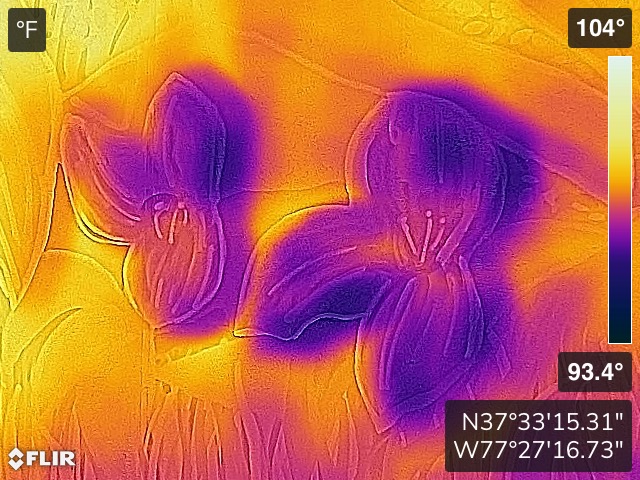
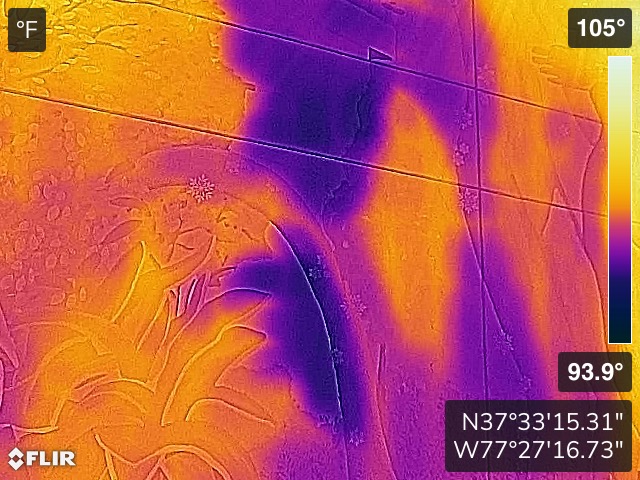
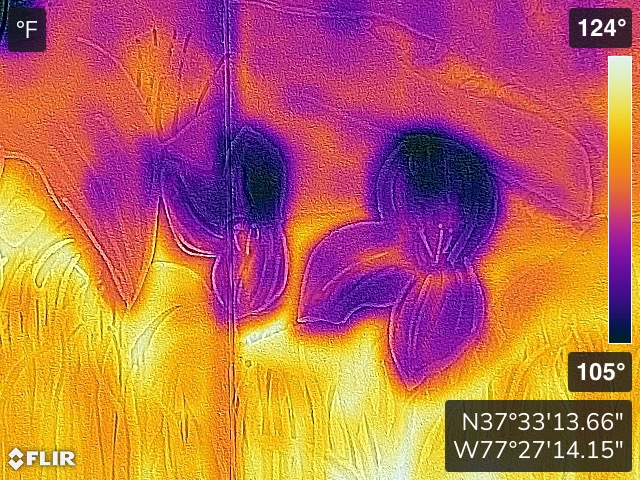
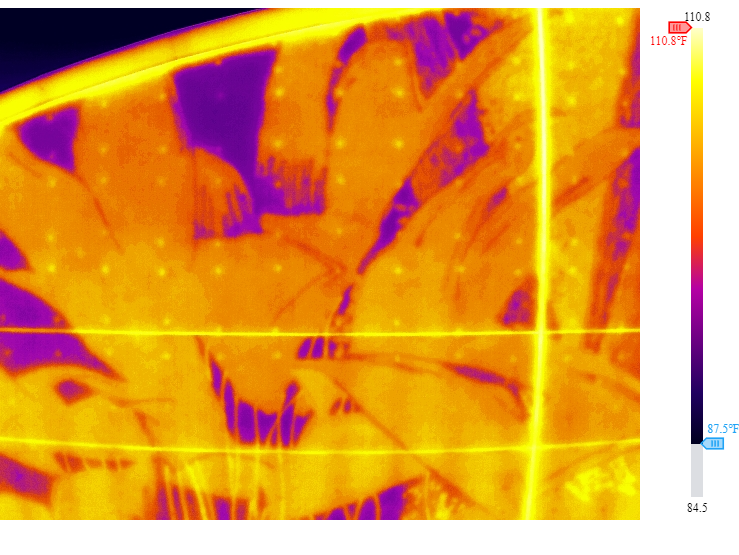
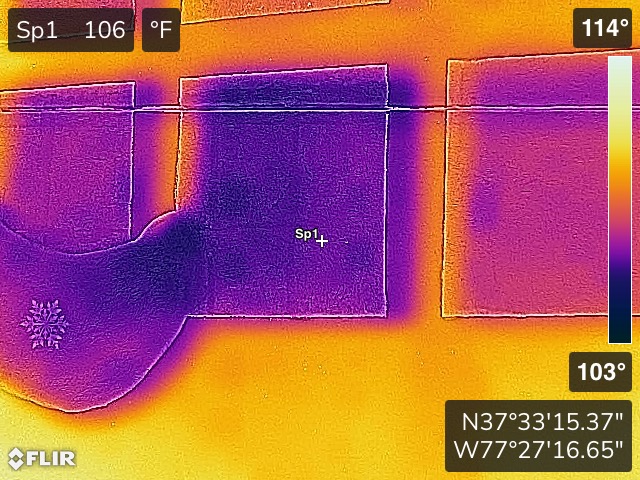
Floral subject (petals of the flower) on the “sustainable city” environment uses three coats of the cool coat sealant with the surrounding environment having one coat of of the cool coat sealant.
Before Cool-Coat Sealant (Flower)
- Capture Date: 7/28/23
- Capture Time: 1:29pm
- Outside Temperature: 94° F
- Capture High Temperature: 106° F
- Capture Low Temperature: 101° F
- Average: 103° F
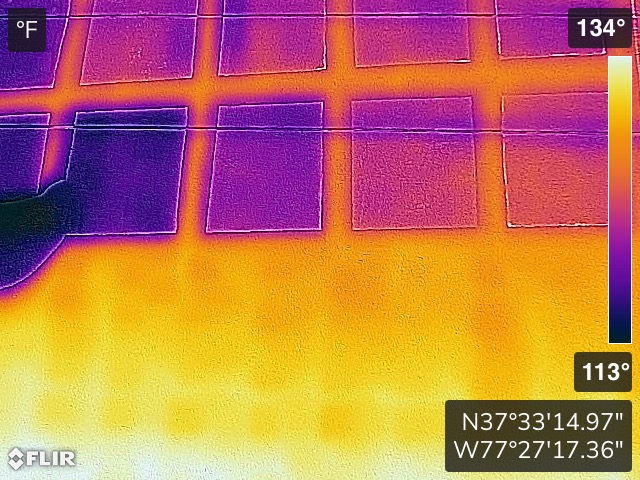
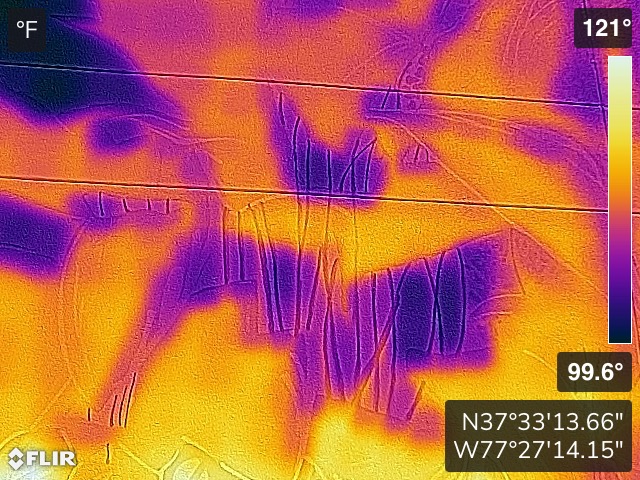
After the Cool-Coat Sealant (Flower)
- Capture Date: 9/6/23
- Capture Time: 1:31pm
- Outside Temperature: 95° F
- Capture High Temperature: 101° F
- Capture Low Temperature: 96.6° F
- Average: 98.6° F (-4.4)

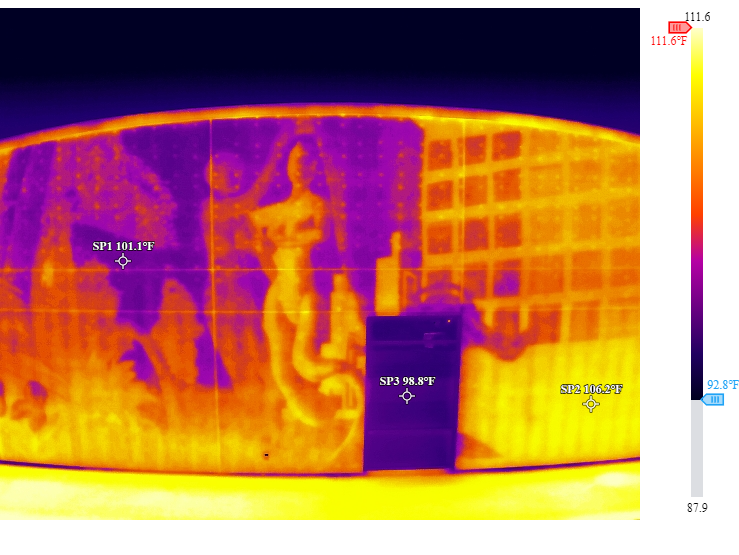
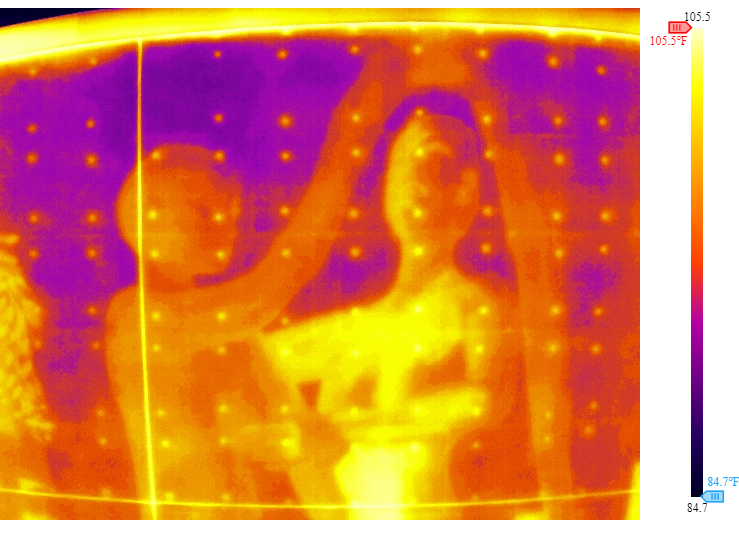
Thermal Difference (Figures)
This video highlights my process of measuring the surface temperature difference of the poly-area averages of the Sustainable and Heat Island Figures. In this capture I took on a 95-degree day at 1:39pm on September 6th, I found a 1.1-degree Fahrenheit temperature difference in the Sustainable City Figure compared to the Heat Island figure.
A summer timelapse I took of the mural heat fading from afternoon (12:50pm) to sunset (8:20pm). The timelapse was taken on July 27th 2024. The absorbed heat on the mural decreased during the last hour leading up to sunset, from 7:40 pm to 8:20 pm.
Sources
Braswell, Mary. “Street Art Meets Climate Science in the Big, Blue Face of Zeus.” UCLA Luskin Center for Innovation, The UCLA Luskin Center for Innovation, 22 Oct. 2019, innovation.luskin.ucla.edu/2019/10/22/street-art-meets-climate-science-in-the-big-blue-face-of-zeus/.
Kwon, S., & Maurakis, E. G. (2020). Variables associated with thermal emittance of wall mural art in Richmond, Virginia. Virginia Journal of Science, 71(1), 17 pp. Online ahead of print. doi: 10.25778/6hjn-a318
Plumer, Brad, et al. “How Decades of Racist Housing Policy Left Neighborhoods Sweltering.” The New York Times, The New York Times, 24 Aug. 2020, www.nytimes.com/interactive/2020/08/24/climate/racism-redlining-cities-global-warming.html.
“Science Meets Art in Exhibition on How Street Murals Can Beat the Heat; Recommendations Result of Faculty/Student Research.” Newsroom, University of Richmond, 9 May 2019, news.richmond.edu/releases/article/-/16311/science-meets-art-in-exhibition-on-how-street-murals-can-beat-the-heat-recommendations-result-of-faculty/student-research-.html.