I used the Flir Ignite Thermal Comparison tool and made a polygon selection around the before and after cool-coat images displaying the sustainable city. I then used the delta tool to compare the two average temperatures of the polygon selections. The video shows the tool measuring the temperature average of the pre-cool-coat capture on the right and the post-cool-coat capture on the left.
The mural’s 1st coat surface layer used regular mural paint. After painting the final colors, I went over the “sustainable city” section of the mural with a clear cool-coat sealant. Two coats are on the sustainable/blue figure, and one coat is on the surrounding environment of the sustainable city. No coats are on the urban heat island/red figure and their environment.
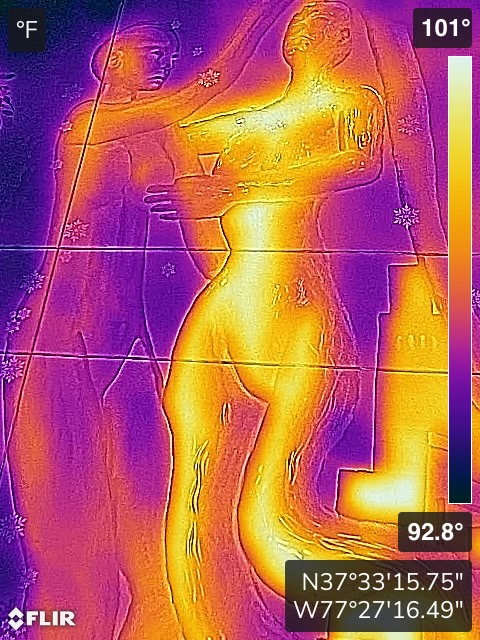
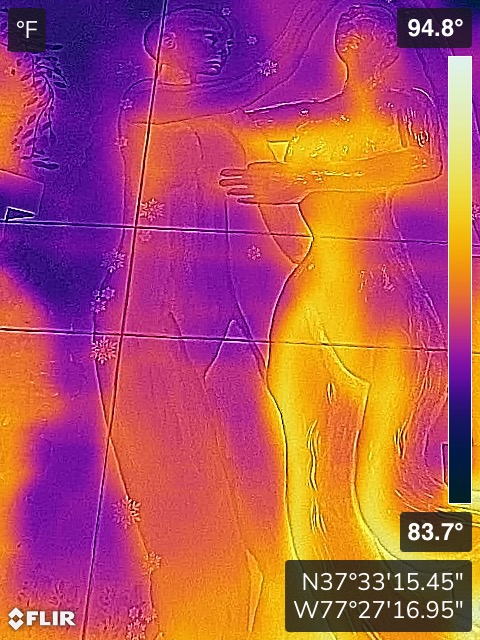
Before Cool-Coat Sealant (Blue Figure)
- Capture Date: 8/5/23
- Capture Time: 2:06pm
- Outside Temperature: 88° F
- Capture High Temperature: 99.1° F
- Capture Low Temperature: 94.3° F
- Average: 96° F
After the Cool-Coat Sealant (Blue Figure)
- Capture Date: 8/20/23
- Capture Time: 2:15pm
- Outside Temperature: 91° F
- Capture High Temperature: 92° F
- Capture Low Temperature: 86.4° F
- Average: 88.3° F (-7.7° F)
Before Cool-Coat Sealant (Flower)
- Capture Date: 7/28/23
- Capture Time: 1:29pm
- Outside Temperature: 94° F
- Capture High Temperature: 106° F
- Capture Low Temperature: 101° F
- Average: 103° F
After the Cool-Coat Sealant (Flower)
- Capture Date: 9/6/23
- Capture Time: 1:31pm
- Outside Temperature: 95° F
- Capture High Temperature: 101° F
- Capture Low Temperature: 96.6° F
- Average: 98.6° F (-4.4)

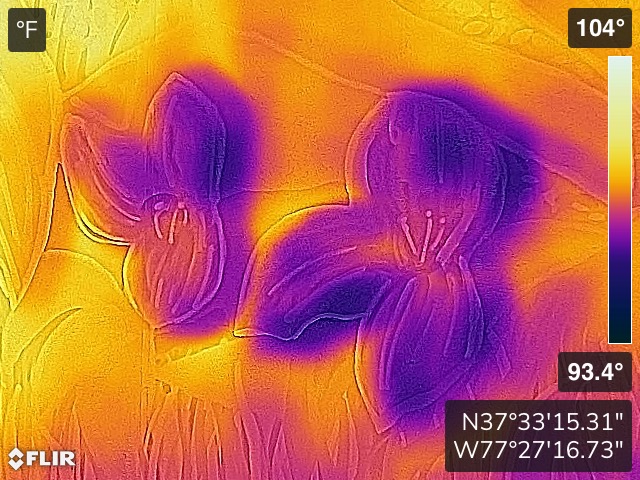
Floral subject (petals of the flower) on the “sustainable city” environment uses three coats of the cool coat sealant with the surrounding environment having one coat of of the cool coat sealant.
This video highlights my process of measuring the surface temperature difference of the poly-area averages of the Sustainable and Heat Island Figures. In this capture I took on a 95-degree day at 1:39pm on September 6th, I found a 1.1-degree Fahrenheit temperature difference in the Sustainable City Figure compared to the Heat Island figure.