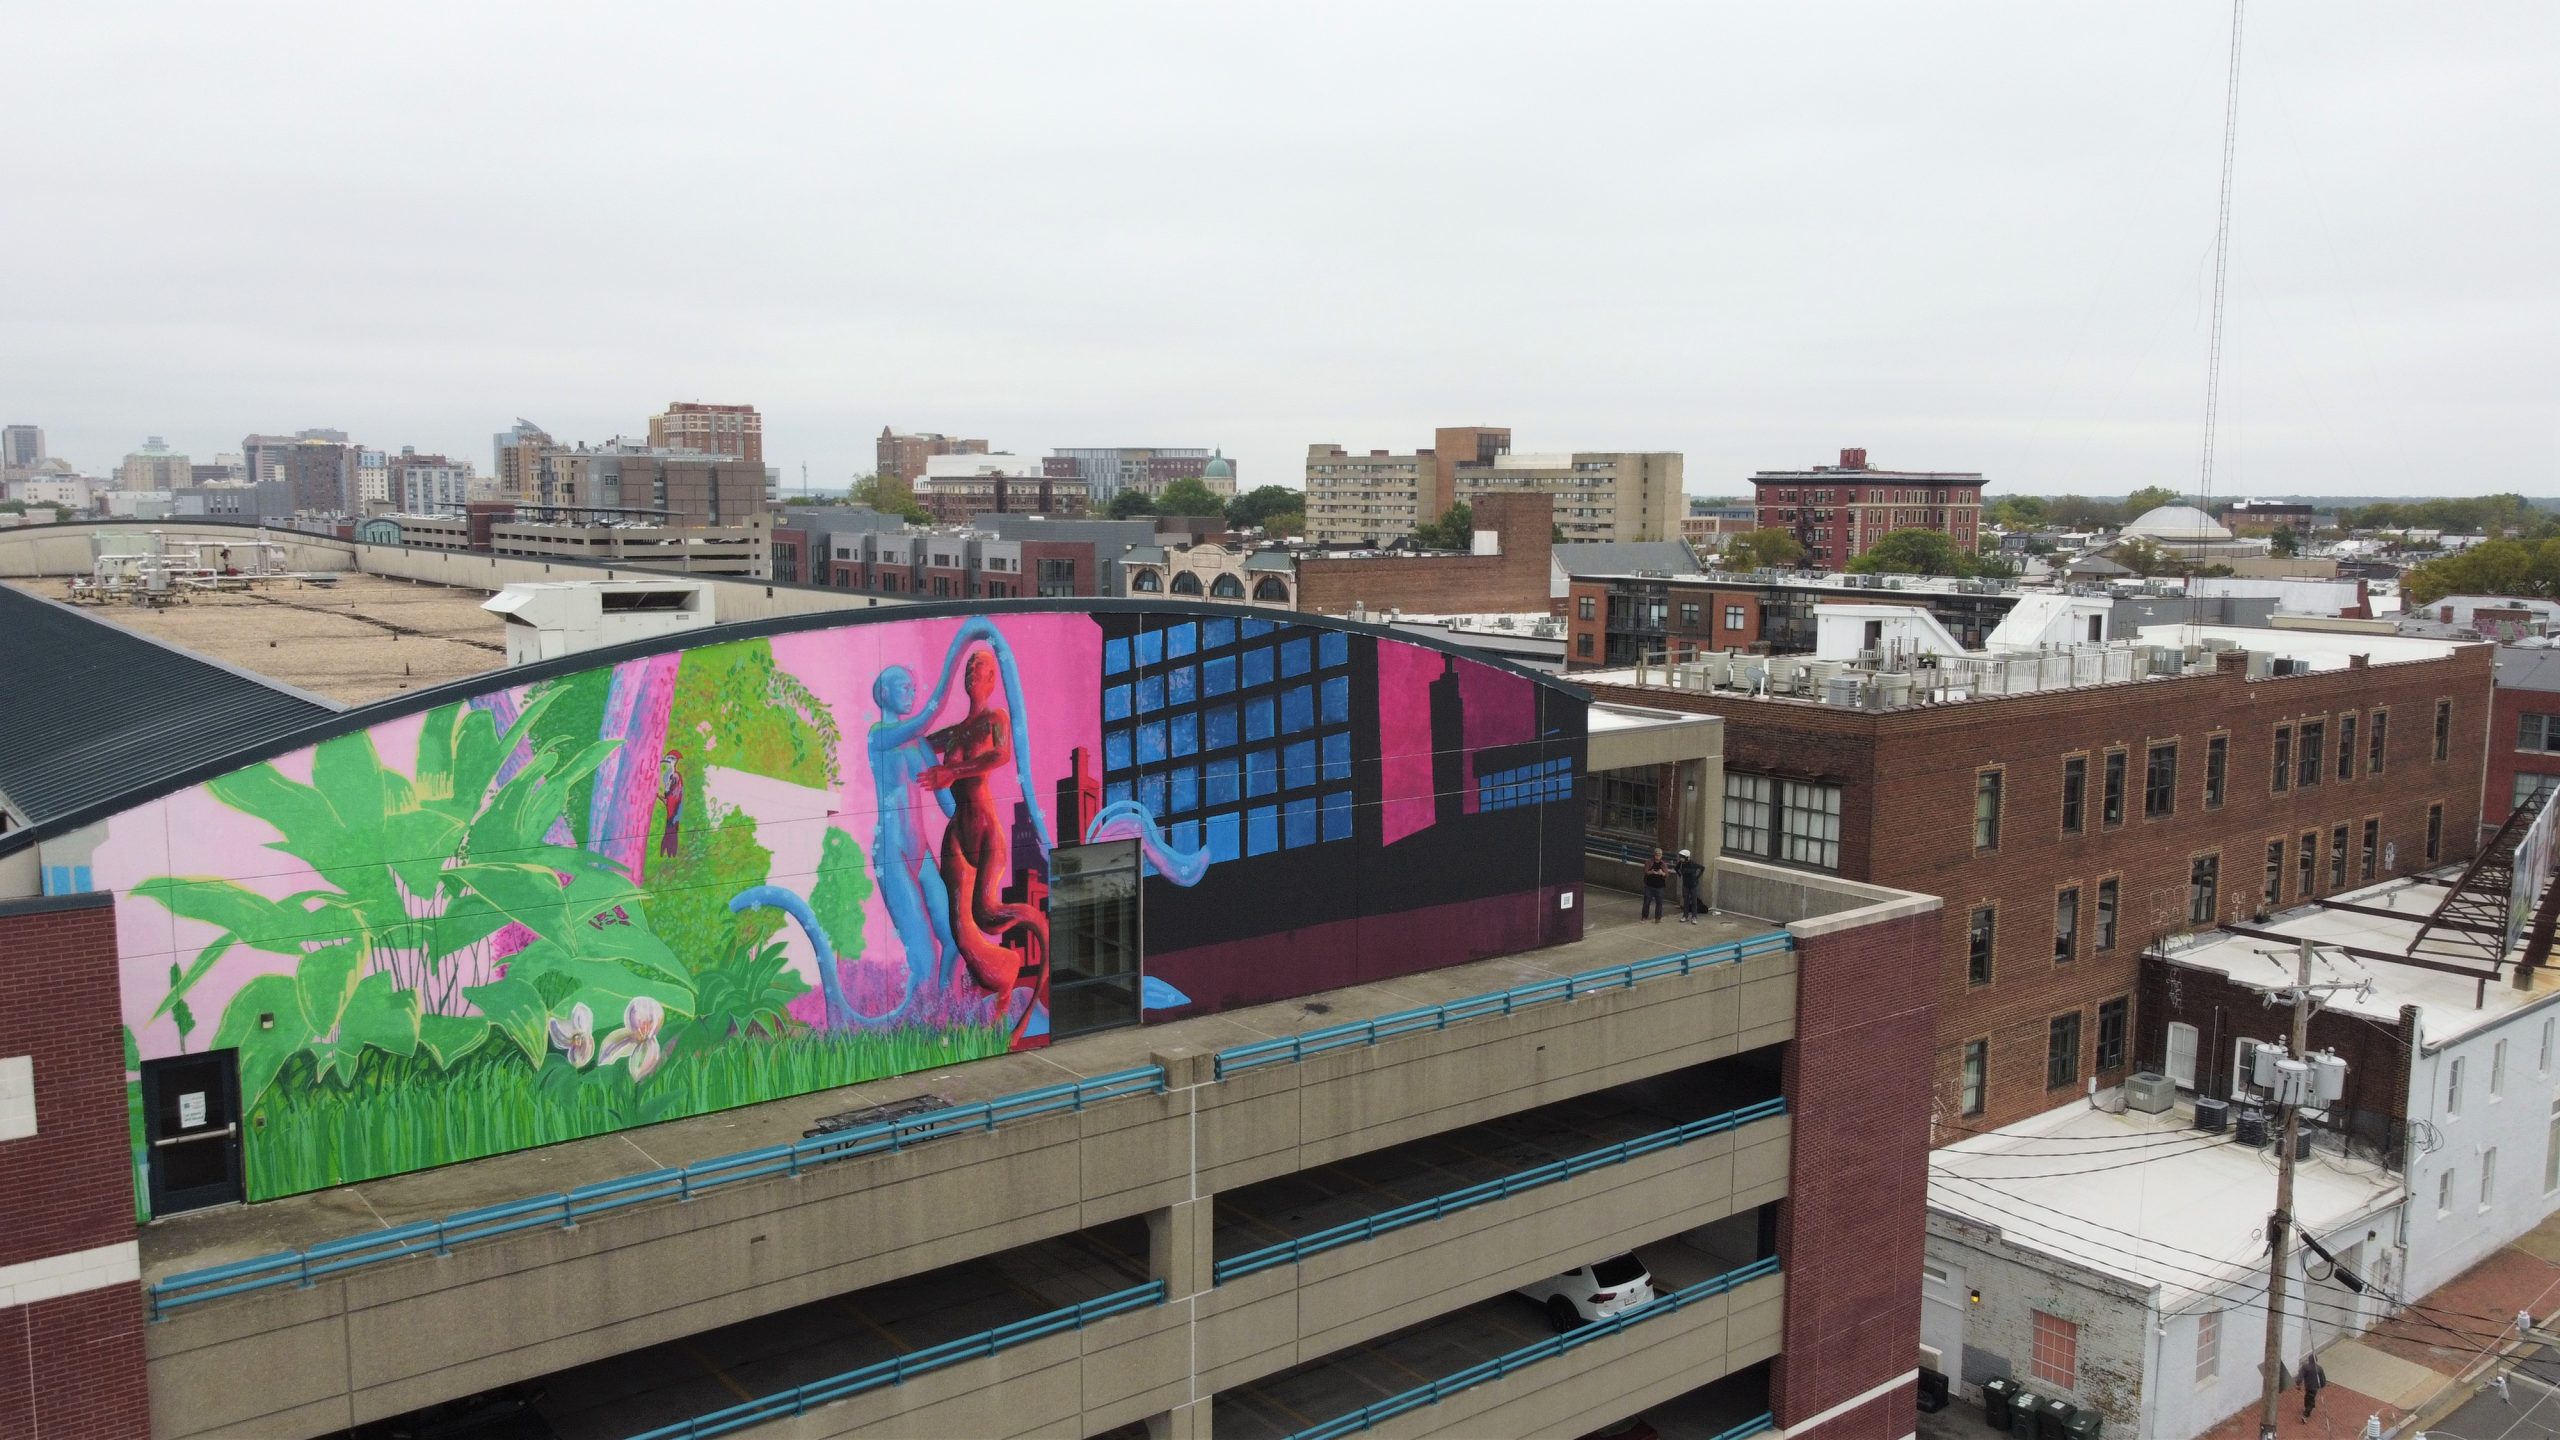
Urban Heat Island Mural

Table of Contents

The density of materials like concrete and asphalt in urban areas increases temperatures locally, creating a much hotter environment than suburban and rural areas which have more vegetation.

Richmond, the location of this mural, is one of the many cities experiencing the urban heat island effect, especially in the redlined communities of the city. Due to racist housing policies, these communities have the least access to temperature-cooling infrastructure and vegetation bearing the worst temperatures in the city.


About the Project

With the help of my Academic Mentor, Roberto Jamora, I created a mural on campus property to educate VCU and local communities about the heat island effect and provided actionable information to reduce this effect with thermal painting.

What is Thermal Painting?

I used a thermal infrared camera to measure the thermal qualities of paint and purposefully painted with these properties to create temperature contrasts.

When I used the thermal painting techniques, the thermal infrared camera visually captured the subjects that figuratively and literally heat or cool urban areas.

How did you paint with thermal properties?

The artistic application of my paint investigated the qualitative contrasts of three methods of thermal painting. First, I measured the appearance of different gradations of tonal shades on thermal contrast. I painted the specified cities with either bright or dark shades. Second, I measured the difference in heat absorption between solar reflective paints and regular mural paints. The third area I measured is how various mark-making techniques with light and dark tones impact the surrounding temperature of the mural. The different tonal painting techniques I explored are gradients, stippling, hatching, layering, blending, and clean-cut color blocking.

Play Video

With the help of my Academic Mentor, Roberto Jamora, I created a mural on campus property to educate VCU and local communities about the heat island effect and provided actionable information to reduce this effect with thermal painting.

What is Thermal Painting?

I used a thermal infrared camera to measure the thermal qualities of paint and purposefully painted with these properties to create temperature contrasts.

When I used the thermal painting techniques, the thermal infrared camera visually captured the subjects that figuratively and literally heat or cool urban areas.

How did you Thermal Paint?

The artistic application of my paint investigated the qualitative contrasts of three methods of thermal painting. First, I measured the appearance of different gradations of tonal shades on thermal contrast. I painted the specified cities with either bright or dark shades. Second, I measured the difference in heat absorption between solar reflective paints and regular mural paints. The third area I measured is how various mark-making techniques with light and dark tones impact the surrounding temperature of the mural. The different tonal painting techniques I explored are gradients, stippling, hatching, layering, blending, and clean-cut color blocking.

The mural’s narrative utilized thermal painting by differentiating the temperatures to their subject matter. Regular mural paint covered the heat island figure and its environment. The solar reflective paint coated the sustainable city form. 

Through a thermal infrared camera, the viewer can see the colors of the cooling temperatures on subjects that lower the heat island effect. Factors that heat an urban area are warmer on the mural surface. Incorporating the painting’s narrative and temperature allows the viewer to determine what factors can cool and heat urban spaces.

Image Slide Comparison

About the Design

I personified two contrasting cities to exemplify the difference between a sustainable city and a city affected by the urban heat island effect. Two figures contrast by color. Their limbs interlock in a pulsing configuration, representing complex and chaotic ecological systems.

The red figure personifies an urban heat island, visibly sweating and in pain from absorbed heat. The surrounding environment of the urban heat island figure displays concrete infrastructure, asphalted roads, and sparse vegetation. The figure’s red paint symbolizes not only heat retention but also the disproportionate heat faced by red-lined neighborhoods in contrast to blue- or green-lined ones.

The blue figure, in contrast, represents a city modeled on sustainability. It is surrounded by forest coverage, wildlife, and infrastructure rooted in garden roofs. The blue figures’ temperature is cooled, symbolizing sustainable urban planning, and their posture is mostly at rest, indicating a harmonious relationship with the environment.

About the Mural Site

The mural’s location is at the Bowe St. Parking Deck/ VCUarts Art Foundation Building on the Student Roof Deck. The wall faces the Lombardy St. Kroger store.

The site is approximately 25 x 91 ft equal to a surface area of ~2,279.17 ft²

Cool-Coat Comparison

Thermal Infrared Captures and data recording are still in progress as of 1/15/24. It is still unclear how much of a cooling difference the solar reflective coating makes. More of the image comparisons will become uploaded when data collecting period has ended.

How did you Compare the Cool-Coat?

I used the Flir Ignite Thermal Comparison tool and made a polygon selection around the before and after cool-coat images displaying the sustainable city. I then used the delta tool to compare the two average temperatures of the polygon selections. The video shows the tool measuring the temperature average of the pre-cool-coat capture on the right and the post-cool-coat capture on the left. 

Slide to see Before and After Comparison
Before
After

The mural’s 1st coat surface layer used regular mural paint. After painting the final colors, I went over the “sustainable city” section of the mural with a clear cool-coat sealant. I documented the before and after comparison with my thermal infrared camera to see how much of a temperature-cooling difference the coat made. Two coats are on the sustainable/blue figure, and one coat is on the surrounding environment of the sustainable city. No coats are on the urban heat island/red figure and their environment.

Before Cool-Coat Sealant (Sustainable Figure)
  • Capture Date: 8/5/23
  • Capture Time: 2:06pm
  • Outside Temperature: 88° F
  • Capture High Temperature: 99.1° F
  • Capture Low Temperature: 94.3° F
  • Average: 96° F
After the Cool-Coat Sealant (Sustainable Figure)
  • Capture Date: 8/20/23
  • Capture Time: 2:15pm
  • Outside Temperature: 91° F
  • Capture High Temperature: 92° F
  • Capture Low Temperature: 86.4° F
  • Average: 88.3° F (-7.7° F)

Floral subject (petals of the flower) on the “sustainable city” environment uses three coats of the cool coat sealant with the surrounding environment having one coat of of the cool coat sealant.

Before Cool-Coat Sealant (Flower)
  • Capture Date: 7/28/23
  • Capture Time: 1:29pm
  • Outside Temperature: 94° F
  • Capture High Temperature: 106° F
  • Capture Low Temperature: 101° F
  • Average: 103° F
After the Cool-Coat Sealant (Flower)
  • Capture Date: 9/6/23
  • Capture Time: 1:31pm
  • Outside Temperature: 95° F
  • Capture High Temperature: 101° F
  • Capture Low Temperature: 96.6° F
  • Average: 98.6° F (-4.4)
Before
After

Thermal Difference (Figures)

This video highlights my process of measuring the surface temperature difference of the poly-area averages of the Sustainable and Heat Island Figures. In this capture I took on a 95-degree day at 1:39pm on September 6th, I found a 1.1-degree Fahrenheit temperature difference in the Sustainable City Figure compared to the Heat Island figure. 

Heat Retention (Winter)

This timelapse records the Winter Heat Retention of the mural. A summer timelapse will be taken in the upcoming 2024 season.

A winter timelapse I took of the mural heat fading from afternoon (12:50pm) to sunset (5:00pm). The timelapse was taken on January 13th, 2024. The absorbed heat on the mural rapidly decreased during the last 10 minutes leading up to sunset, from 4:50pm to 5:00pm.  I plan to film another one over next summer to contrast the winter’s quick retention of absorbed heat on the mural’s surface compared to the Heat Island figure. 

For more thermal infrared captures and comparisons click here >> Urban Heat Island Thermal Infrared Captures

Mural Time-Lapse

Sources

Braswell, Mary. “Street Art Meets Climate Science in the Big, Blue Face of Zeus.” UCLA Luskin Center for Innovation, The UCLA Luskin Center for Innovation, 22 Oct. 2019, innovation.luskin.ucla.edu/2019/10/22/street-art-meets-climate-science-in-the-big-blue-face-of-zeus/.

Kwon, S., & Maurakis, E. G. (2020). Variables associated with thermal emittance of wall mural art in Richmond, Virginia. Virginia Journal of Science, 71(1), 17 pp. Online ahead of print. doi: 10.25778/6hjn-a318
 

Plumer, Brad, et al. “How Decades of Racist Housing Policy Left Neighborhoods Sweltering.” The New York Times, The New York Times, 24 Aug. 2020, www.nytimes.com/interactive/2020/08/24/climate/racism-redlining-cities-global-warming.html.

“Science Meets Art in Exhibition on How Street Murals Can Beat the Heat; Recommendations Result of Faculty/Student Research.” Newsroom, University of Richmond, 9 May 2019, news.richmond.edu/releases/article/-/16311/science-meets-art-in-exhibition-on-how-street-murals-can-beat-the-heat-recommendations-result-of-faculty/student-research-.html.